Case Study: Ondash Architecture
Ondash is a financial analytics platform that takes accounting XML files and turns them into interactive dashboards, reports, and AI-powered insights. Behind the simple user experience — upload a file, get a report — is a microservices architecture with seven services, two databases, a message bus, and a real-time WebSocket layer.
This post walks through the architecture: what each service does, how they communicate, and the design decisions that shaped the system.
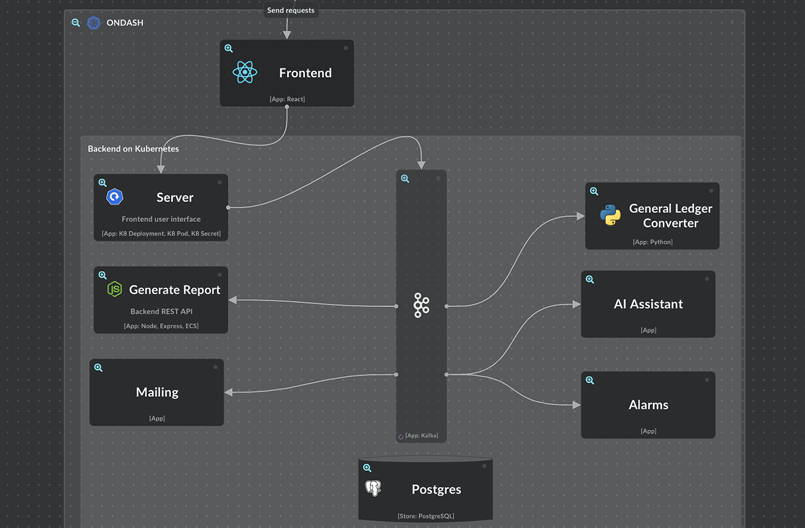
System Overview
The platform is built as a collection of independent services, each responsible for a specific capability:
| Service | Language | Purpose |
|---|---|---|
| Frontend | React/TypeScript | Web UI with dashboards, charts, chat |
| Backend | Python/FastAPI | GraphQL API, business logic, data orchestration |
| Finan | Python/FastAPI | Hungarian accounting XML processing |
| Agent | Python/LangChain | AI task decomposition and scenario execution |
| Update Broker | Go | Real-time WebSocket gateway |
| Report Engine | Bun/TypeScript | PDF generation via headless Chrome |
| Bun/TypeScript | Email notifications and report delivery |
Services communicate through two channels: GraphQL for synchronous request-response, and Redpanda (Kafka-compatible) for asynchronous events. The distinction is deliberate — commands that need a response use GraphQL; notifications where the producer doesn't care about consumers go through Kafka.
Data Flow: From XML to Dashboard
The end-to-end flow from file upload to interactive dashboard:
- User uploads XML — The frontend sends the accounting file to the backend, which stores it in AWS S3
- Finan processes the XML — Extracts company data, accounts, journal entries, and partner information from the Hungarian accounting format
- Embeddings are generated — Account names are sent to OpenAI's text-embedding model for semantic search capability
- Data persists to PostgreSQL — Each company gets its own schema (multi-tenancy via schema isolation)
- Standard codes are assigned — An LLM matches accounts to standardized accounting codes using embeddings for context
- KPIs are calculated — Financial metrics (liquidity, solvency, profitability) are computed from the processed data
- Dashboard queries execute — The backend runs parameterized SQL queries against the company's data
- Real-time updates propagate — The update broker pushes changes to connected clients via WebSocket
- Charts render — The frontend visualizes results with ECharts
- PDF export — The report engine captures the dashboard as a PDF using Puppeteer
Frontend
Stack: React 18, TypeScript, Vite, Chakra UI, Apollo Client
The frontend is a single-page application built around a dashboard system. Each dashboard contains widgets (charts, tables, metrics) and parameters (filters like month, year, account type). When a user changes a parameter, the system identifies which widgets are affected, re-runs their SQL queries with the new parameter values, and updates the display.
Parameters use a template syntax in SQL queries:
WHERE DATE_TRUNC('month', e.date) = @month::date
AND account_type = @account_type
The @parameter_id placeholders are substituted server-side before execution. This keeps the SQL readable while making dashboards dynamic.
Real-time updates come through the Update Broker's WebSocket connection. The frontend uses a React Context with hooks (useWebSocket, useTopicData) to subscribe to relevant topics and filter incoming messages client-side.
Backend
Stack: Python 3.9+, FastAPI, Strawberry GraphQL, MongoDB, PostgreSQL
The backend is the central orchestration layer. It exposes a GraphQL API (via Strawberry) that handles all data operations: CRUD for dashboards, projects, users, and chat; parameterized queries against company databases; and file management via S3.
MongoDB stores flexible documents — dashboard configurations, chat histories, project metadata, user settings. PostgreSQL stores structured financial data where ACID transactions and complex queries matter.
The repository pattern abstracts database access. Each adapter (MongoDB, PostgreSQL) implements a common interface, making it possible to swap storage backends without touching business logic.
Multi-tenancy is handled at two levels: MongoDB uses project-based isolation (each user sees only their projects), while PostgreSQL uses schema-per-company (the finan service creates a new schema for each uploaded company file).
Finan: Financial Data Processing
Stack: Python, FastAPI, PostgreSQL (with pgvector), SQLModel
The finan service is specialized for Hungarian accounting XML files (Fökonyvi format). It runs a processing pipeline:
- Parse XML — Extract company info, partners, journal entries, accounts
- Generate embeddings — Send account names to OpenAI's
text-embedding-3-smallmodel - Merge into PostgreSQL — Upsert logic handles re-uploads gracefully
- Build monthly aggregates — Roll up journal entries into account-level monthly totals
- Assign standard codes — Match accounts to standardized accounting codes using LLM + embedding similarity
- Calculate KPIs — Compute financial health indicators
The embedding step enables semantic search: even if two companies use different names for the same account type, the vector similarity finds the match. This is what allows the standard code assignment to work across different accounting conventions.
Agent: AI-Powered Analysis
Stack: Python, FastAPI, LangChain, OpenAI/Anthropic
The agent service handles natural language queries about financial data. When a user asks a question in the chat, the agent:
- Decomposes the query into atomic tasks
- Maps tasks to scenarios — chart generation, dashboard creation, data lookup, etc.
- Executes scenarios with access to the company's data
- Streams results back via Kafka events
The event schema uses three Kafka topics:
ondash.llm.status— Progress updates (with a completion flag)ondash.llm.error— Error notificationsondash.llm.answer— All content responses (text, charts, tables, widgets, dashboards, forms)
This separation means the frontend can show a progress indicator while the agent works, display errors immediately, and render results as they arrive — all through the same WebSocket channel.
Update Broker: Real-Time WebSocket Gateway
Stack: Go, Gorilla WebSocket, Kafka-go, Protocol Buffers
The update broker bridges the event-driven backend with the browser-based frontend. It consumes messages from Redpanda (Kafka), deserializes them from Protocol Buffers, converts to JSON, and broadcasts to subscribed WebSocket clients.
The hub-and-spoke architecture keeps things simple: one Hub manages all client connections, routes messages based on topic subscriptions, and handles filtering. Providers (Kafka, MQTT) run as goroutines, auto-starting when a client subscribes and auto-stopping when the last subscriber leaves.
Messages are sent once per client regardless of how many subscriptions match, preventing duplicates. The frontend handles fine-grained filtering client-side.
Report Engine and Mail
Report Engine (Bun/TypeScript) generates PDFs by rendering dashboards in headless Chrome via Puppeteer. This guarantees visual fidelity — the PDF looks exactly like the screen. Text remains selectable and copyable.
Mail (Bun/TypeScript) sends reports and notifications via SMTP, with support for attachments and inline charts.
Both services are intentionally simple — they do one thing and do it well.
Infrastructure
Kubernetes (EKS) orchestrates all services. ArgoCD provides GitOps-based continuous deployment — push to main, and changes deploy automatically. Each service builds as a multi-architecture Docker image (amd64 + arm64) via GitHub Actions and pushes to AWS ECR.
Monitoring uses Grafana with Loki for log aggregation and Better Stack for centralized logging. Loki parses logs in logfmt format, making it easy to filter by service, level, or custom fields.
Message format across services uses Protocol Buffers (not JSON) for type-safe, compact inter-service communication. A shared ondash-schemas repo holds all .proto definitions, ensuring services agree on message structure at compile time.
Key Design Decisions
Commands vs. Events. Synchronous operations (GraphQL mutations) are commands — the caller needs a response. Asynchronous notifications (Kafka) are events — the producer doesn't know or care who consumes them. This distinction keeps the architecture clean and prevents accidental coupling.
Schema-per-company multi-tenancy. Instead of a company_id column on every table, each company gets its own PostgreSQL schema. Queries are simpler (no WHERE clause needed), data is physically isolated, and dropping a company is just DROP SCHEMA.
Protobuf-first messaging. JSON is flexible but error-prone at scale. Protobuf schemas catch mismatches at build time and produce smaller payloads. The schema registry ensures all services speak the same language.
Two databases, each for its strength. MongoDB for flexible, evolving documents (dashboards, settings). PostgreSQL for structured, queryable data (financial records). Trying to use one for both would mean compromises in either direction.